Preface
The research I worked on is sensitive. For straightforward reasons, I’m leaving out details and results that can’t be shared publically. Here’s the final slide deck of our presentation.
I.
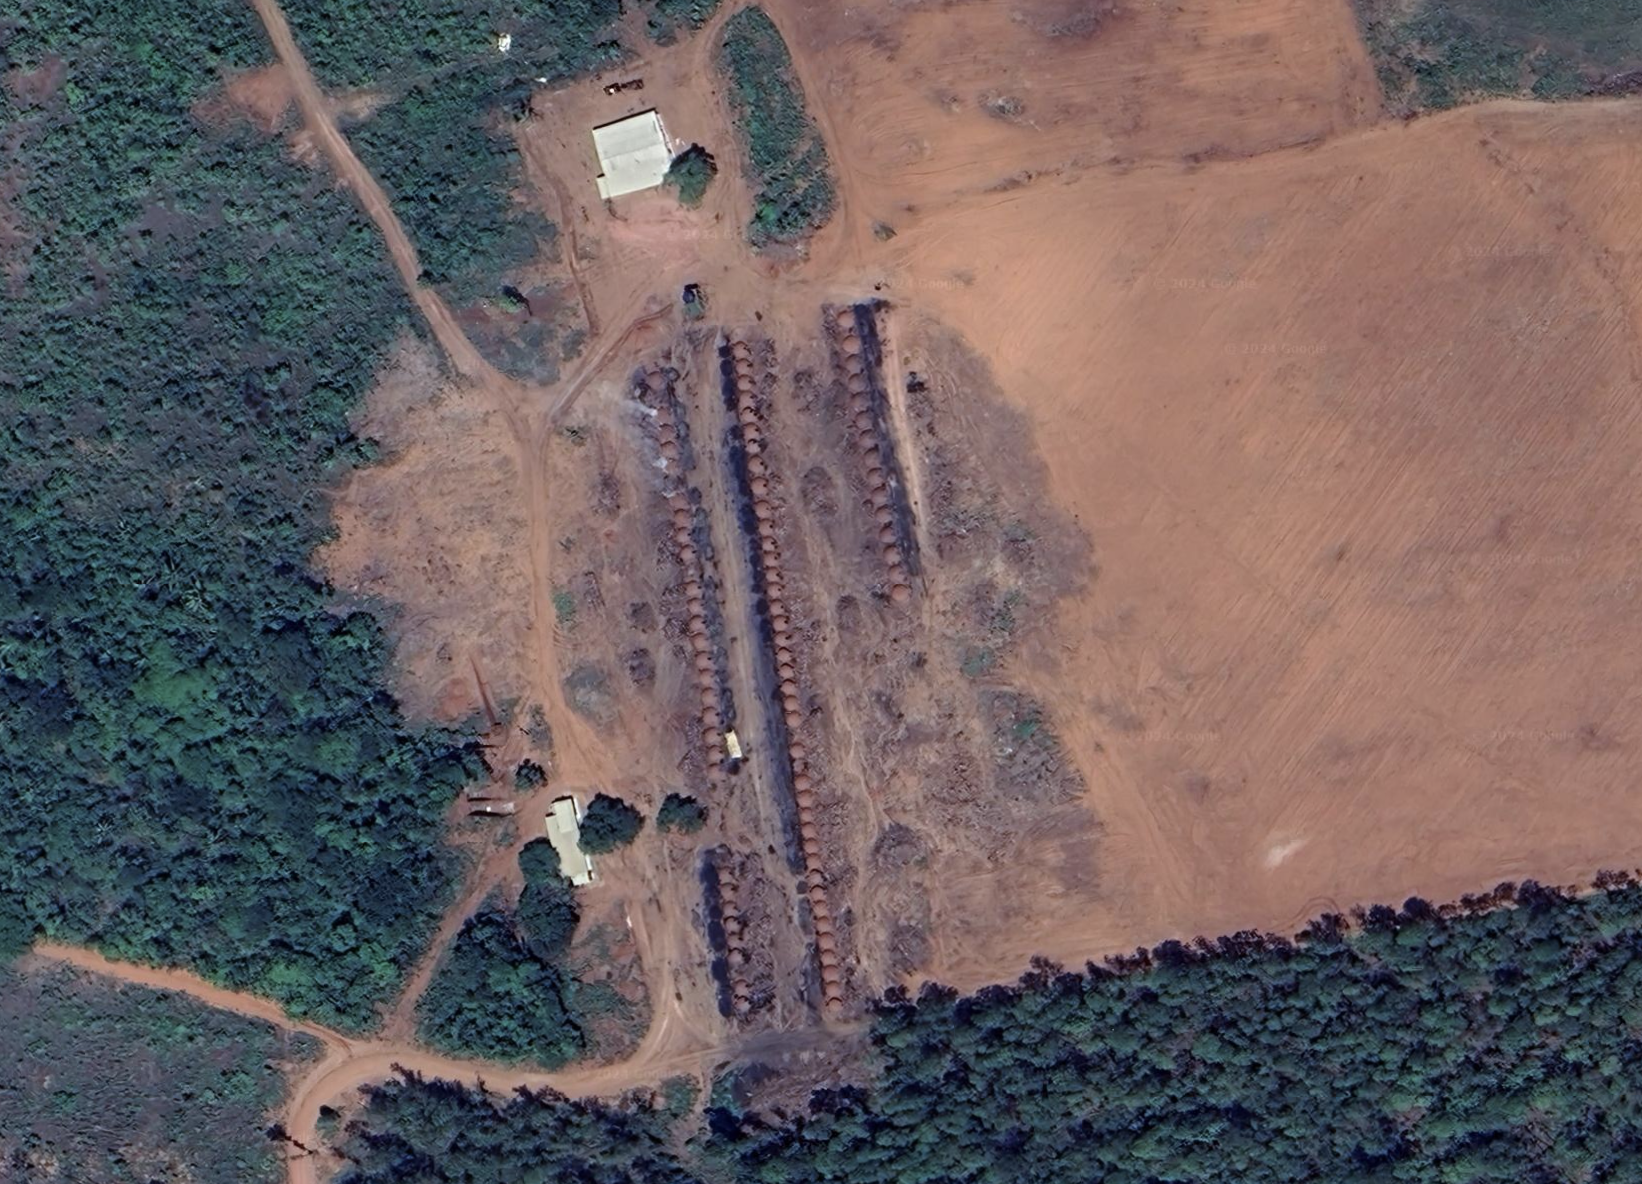
Here’s some context for what I worked on this summer. In Brazil’s forests, a curious structure repeats itself every so often: parallel lines of circular structures with black mounds lying in front of them. Each circular structure is a kiln used to transform wood into charcoal. They are the telltale signs of charcoal production kilns. Here’s a Google Earth image of what one looks like.
Over the past decade, Brazil has been one of the world’s leading producers of crude steel.1 In 2023 it was the ninth largest producer of crude steel in the world. In 2022 it was the largest producer of charcoal in the world—fuel to feed the steel industry. Yet, the process of producing charcoal is typically intertwined with violence and exploitative labor. This is partly a consequence of the dangerous and illegal nature of the work. I think it’s relatively straightforward to see why—chucking wood into these suffocatingly hot kilns and trying not to choke on the fumes seems pretty awful. Since 1995, about 2,830 people have been rescued from what Brazilian authorities define as slavery-like conditions. And it’s worth pointing out that illegal charcoal production has been difficult to combat since the work is typically done in remote locations and the sites operate for a finite amount of time.
The Stanford Human Trafficking Data Lab and Brazilian Federal Labor Prosecution Office are collaborating to use a remote detection tool called CHAR to locate charcoal sites quickly and accurately. The Human Trafficking Data Lab developed a computer vision model trained on low-resolution, high-frequency satellite imagery to accurately identify and pinpoint zones where forced labor is likely used to produce charcoal. Human post-processing is then used to select sites for task force site inspection. The technology allows for a “more proactive anti-trafficking intervention, moving beyond merely reactive, tip-driven initiatives.”
Pipeline
Satellite Imagery ➔ CHAR ➔ Manual Processing ➔ Brazilian Task Force
The major wrinkle with the existing model is its high rate of false positives, confusing roads, rivers and other visually similar features to the two parallel lines that are distinctive of charcoal kilns. As a consequence human post-processing often involves looking at images that cannot be charcoal sites due to their location, e.g. being in the ocean, on a highway, etc. Successful improvements over the current manual labeling would speed up task force prioritisation and therefore the potential to improve high-level anti-trafficking outcomes, that is, workers rescued. To this end, our project developed a downstream Gradient Boosting Classifier model trained on appropriately selected geospatial and survey data to augment the upstreams model’s accuracy.
II.
I think there’s a few modalities from which you can look at the task we set ourselves. The intuition behind using geospatial data is that there is some signal in the data since there are presumably various important considerations that the people who set up the charcoal sites have to make. On one hand, you might want to construct a charcoal production site near a road since you ultimately are transporting the charcoal on trucks to be burned somewhere else. On the other hand, maybe you might not want the site too close to the road since that increases the risk you are discovered. Equally, for other features like waterbodies, you might make similar arguments re the quality of the soil/vegetation that might incentivise a charcoal producer to locate further/closer to a waterbody. The goal was to prioritise developing an interpretable model rather than a black box model since that would probably be more useful for the taskforce in Brazil. There might also be some second/third order effects that our geospatial features are proxying for, but our main goal was to generate as many potentially salient geospatial as possible and then think about removing some and testing which combination of variables improved the model’s performance.
Using GeoPandas, features were calculated using two key metrics: calculating the shortest distance to features and counting how many specific features lie within a defined radius of a site. In total, we constructed a suite of 17 variables using this approach. The intuition behind the shortest distance feature is relatively straightforward and what I flagged above. The reasoning behind the density metric was twofold. First, density of a particular feature, e.g. watermasses, might proxy for soil/biome types that contains some signal for whether setting up camp makes sense. In particular, you might imagine that setting up in a bog or marshy land would be rather inconvenient. Second, depending on the feature chosen, there might be some sort of clustering going on which we want to identify. At first blush, merely looking at a map of where the true positive sites are doesn’t really provide you with any intuition as to what is going on.
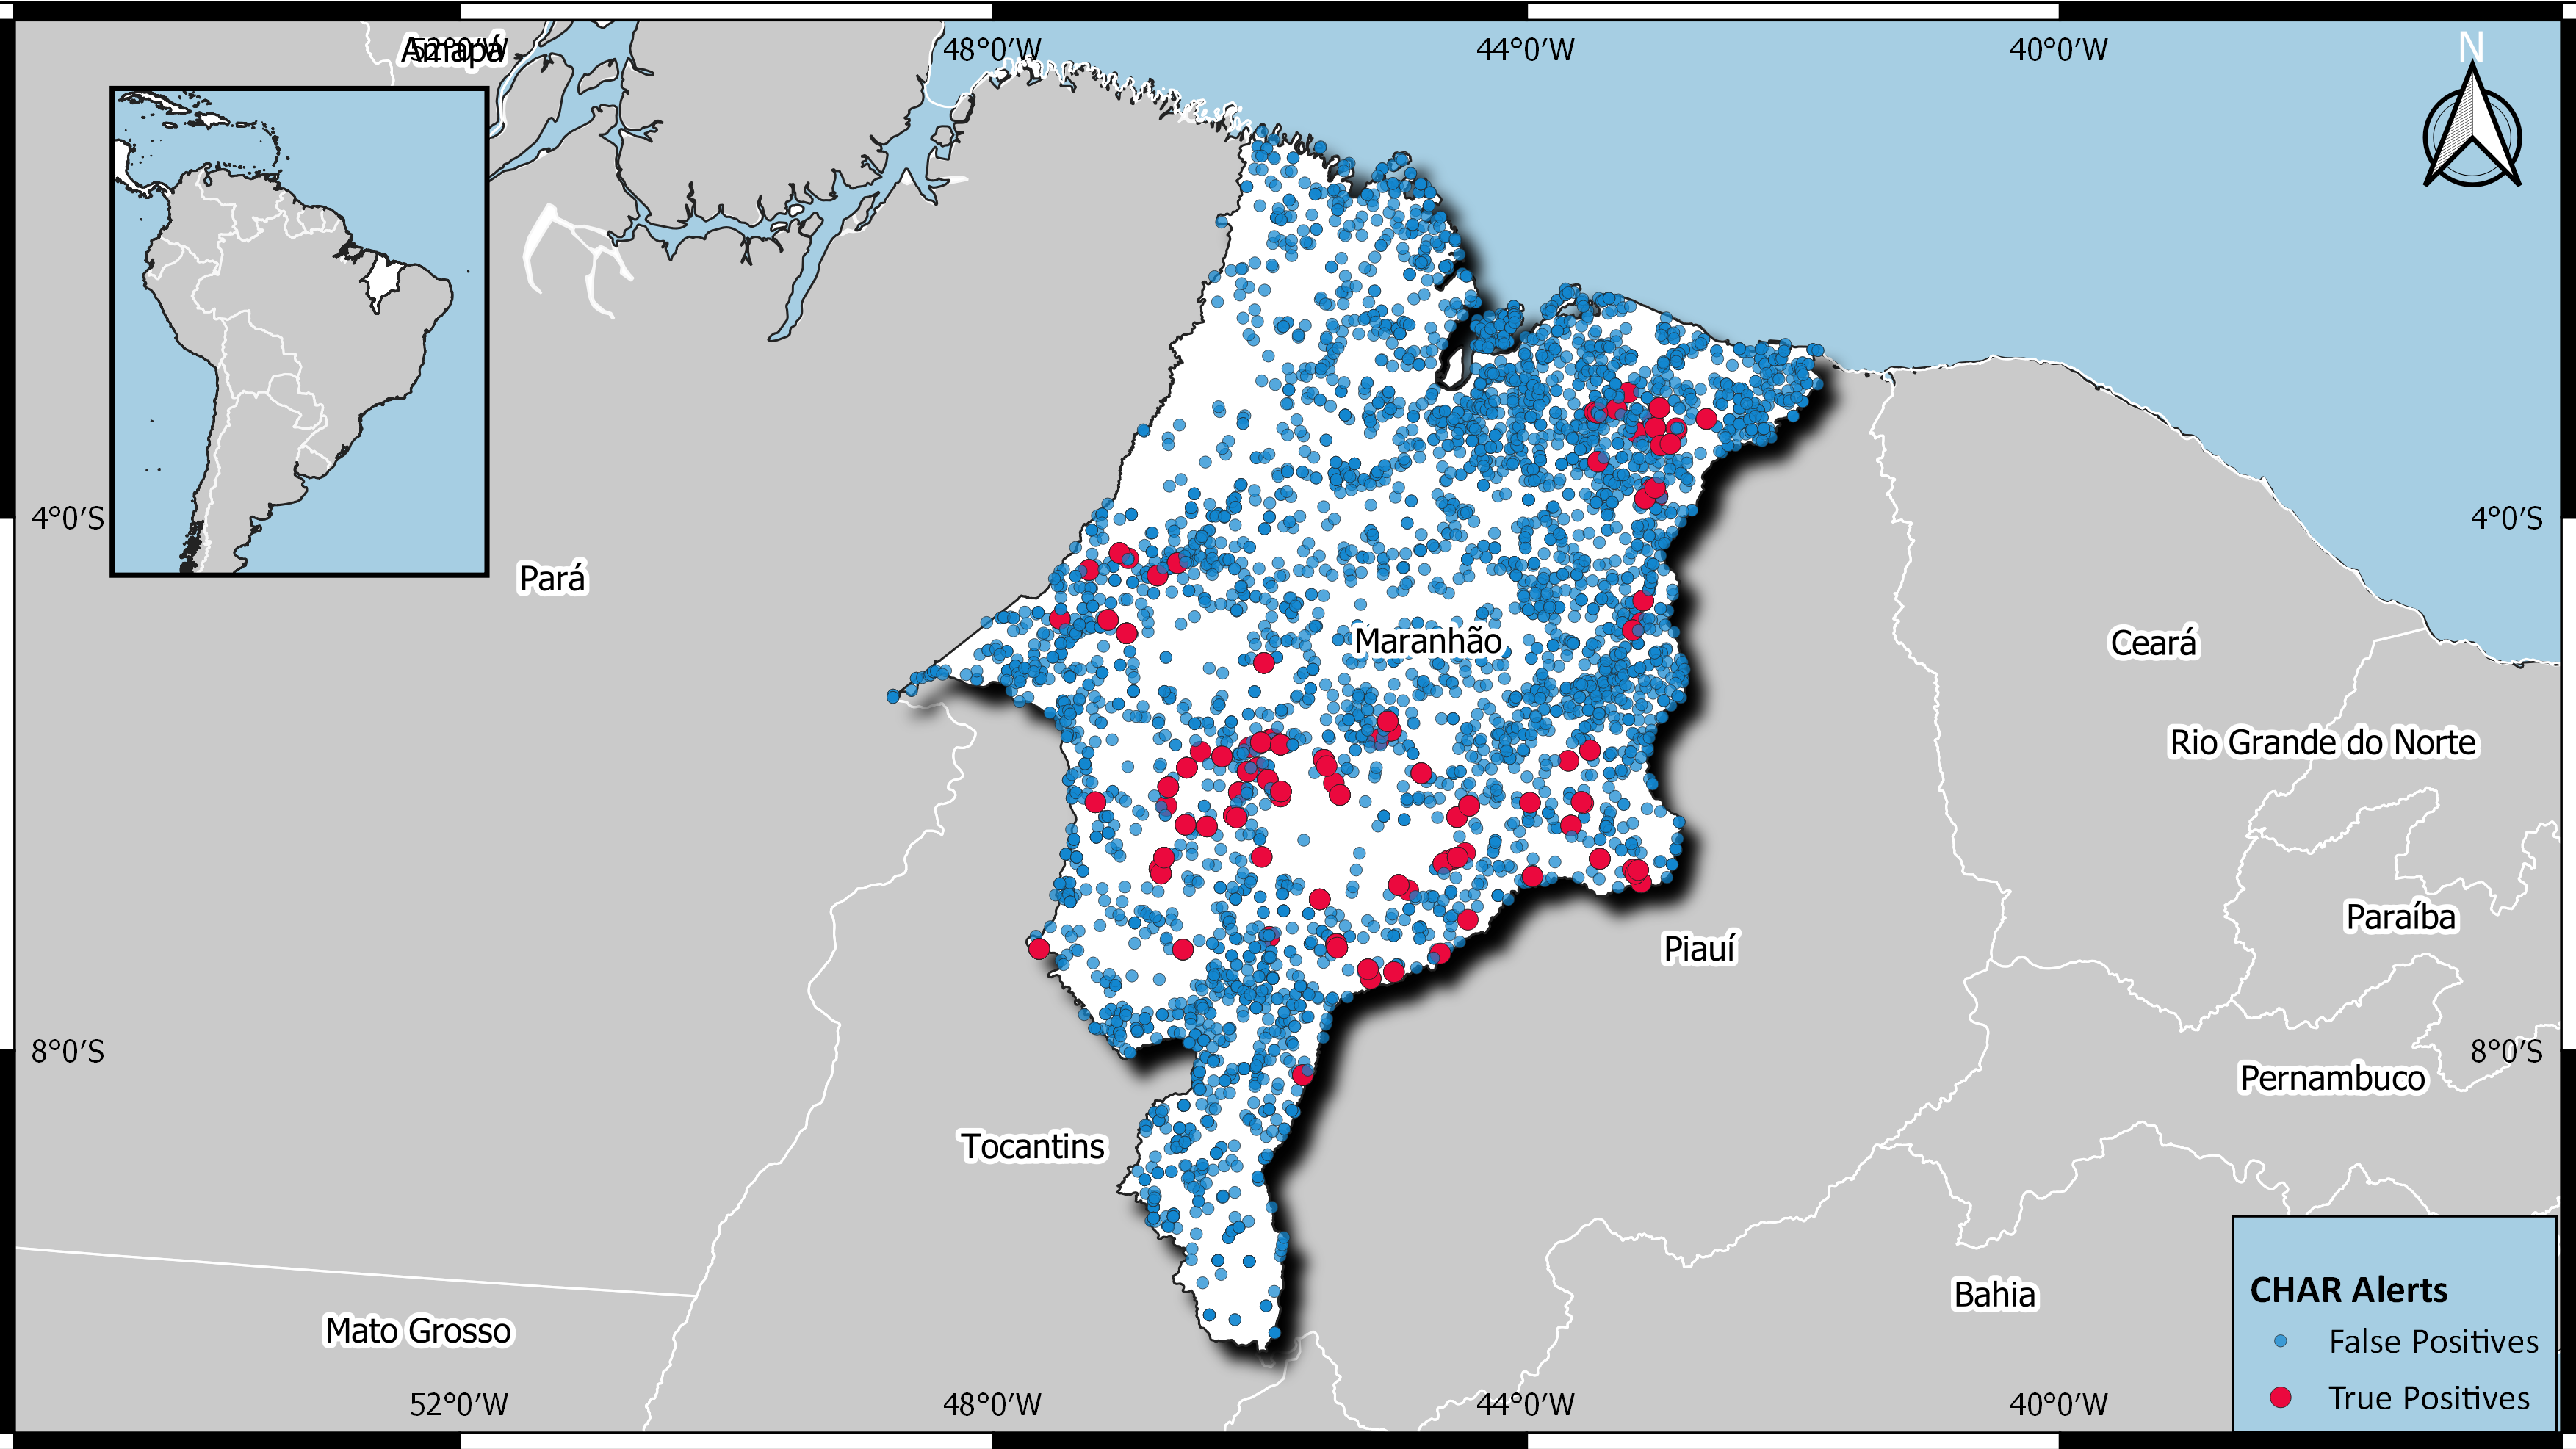 Calm lil map I made.
You might be thinking that geography isn’t the only important consideration. Sure, maybe being too close to the road might make it more likely that you’re caught—but that assumes there are police etc. prowling looking for charcoal sites. Why don’t they just set up somewhere that’s poor and can’t afford to have a large police presence? This is a good point! We recognised geography alone cannot capture all the nuances associated with charcoal site selection, so we expanded our feature set to include socio-economic variables. These were leveraged from MapBiomas and SmartLab datasets in order to proxy or directly price-in other salient variables. The MapBiomas dataset—updated biweekly by the Brazilian government—provides geometries of areas that have been deforested, independent of its legality. Since charcoal production requires wood, it stands to reason that charcoal sites are likely to be nearby to deforestation alerts.
The SmartLab dataset contains socio-economic survey data for every municipality in Brazil. This includes metrics such as literacy rate, poverty rate, and the number of workers rescued from conditions akin to slavery. Such variables serve as proxies for the socio-economic status of the region, which might influence site selection. In particular, areas with lower literacy rates and higher poverty may be more vulnerable to illegal charcoal production on account of potentially lowered detection risks and easier recruitment of labour. With these socio-economic variables constructed our dataset included 38 constructed features.
Did we even check if these variables actually have any signal? Let’s take a look at this graph of a distance feature of true positive and false positives.
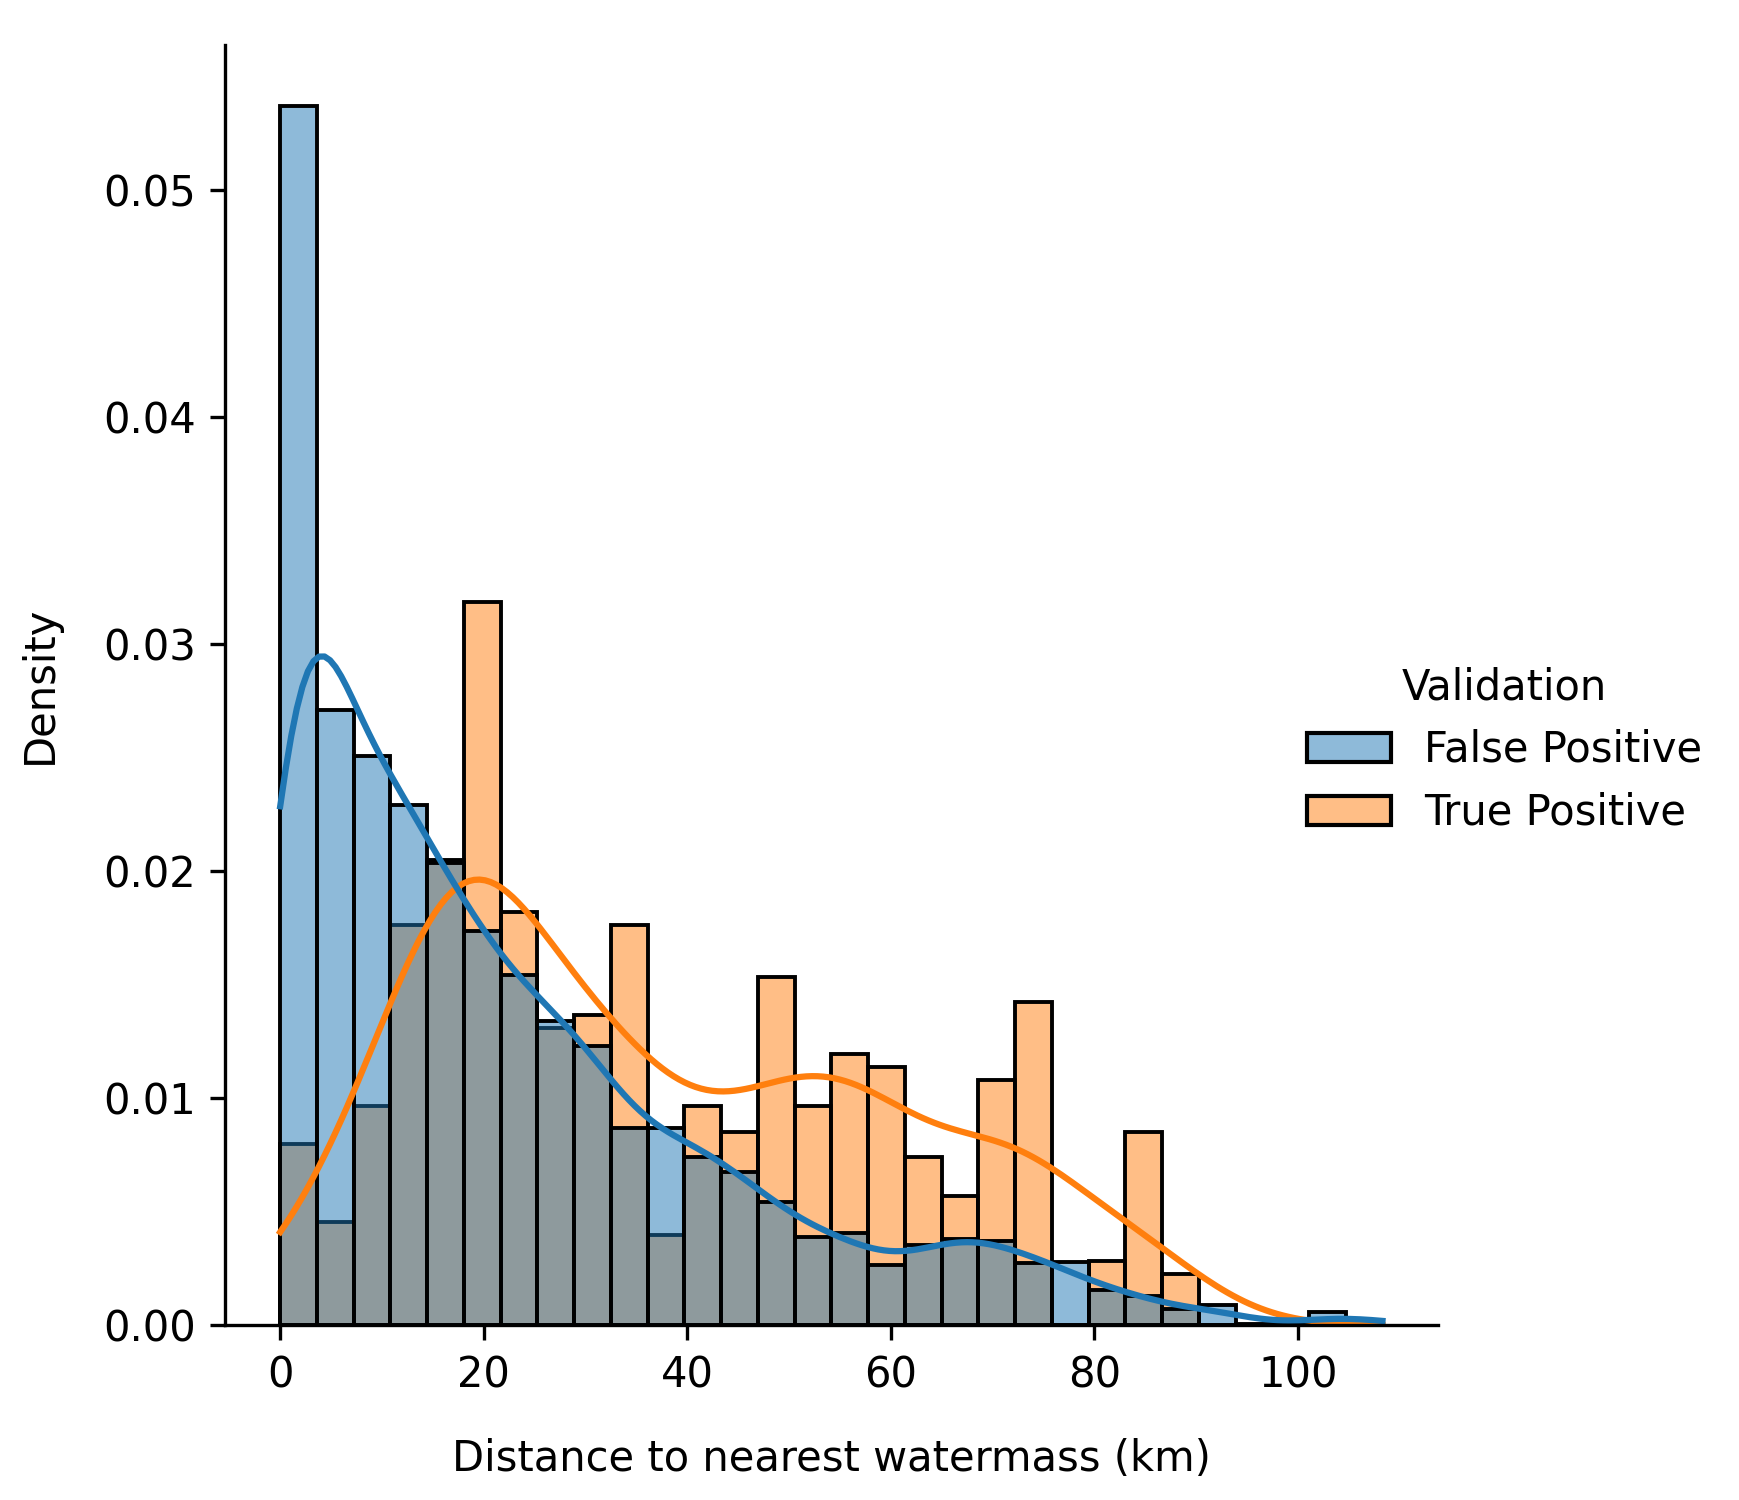 Calm luh graph.
I think the answer is yes. Immediately, you can look at this and note that we can discount anything that within, say, 50m of a watermass. The gradations on this graph are not fine enough to show it, but there is a fairly large grouping of false positive on or very near 0m from a watermass. As I flagged earlier, we obviously can’t have a charcoal site in the ocean or in the middle of a lake or river. We repeated this for every variable: there’s no point adding a variable that has no ability to discern between true and false positives.
III.
We have to very careful in how we train the model. Somewhat unsurprisingly, charcoal sites are operational for several months so our dataset contains multiple images of the same location over time. Thus, we needed to group each photo by their unique location id in order to prevent any leakage from our training into our test data. From here, we group and stratify the data across the training validation split and the individual cross validation folds. On our first attempt at training the model, we had a suspiciously high F1 score, which we soon figured out wasn’t a result of our intelligence or any sort black box of tricks (I wish) and was because we hadn’t grouped the data correctly.We needed to stratify to balance the proportion of true positives across each split. Using StratifiedGroupKFold we automated this and confirmed that approximately 9% of true positives across all splits and with no overlapping locations. We saved one sixth of the data for validation, with the rest going to 5-fold cross validation during training.
Our mentor told us his intuition was that a Gradient Boost Classifier model would work best for our task, but encouraged us to explore. We ended up throwing lots of model architectures at the wall and saw what stuck. We tried logistic regression with l1, l2, and elasticnet penalties, SVMs, various tree-based methods, and a pretrained transformer based model for tabular data (TabPFN). In the end, the Gradient Boost Classifier was still the best. We did some hyperparameter tuning as well using GridSearchCV to tweak max depth, learning rate, subsample proportion, and so on.
I can’t even really remember how long it took for us to get to this point. There’s something quite cruel about typing up—what was probably a few weeks of work—in about two paragraphs. To be fair, a large portion of any sort of ML work is just waiting around for models to be trained (at least if you don’t have vast compute resources available to you—we didn’t).
IV.
So what? Show me the results!
| Metric | Value |
|---|---|
| F1 | 71.1% |
| Recall | 65.8% |
| Precision | 78.8% |
For a model that has only been trained on geospatial and survey data I think this is pretty impressive! Of course, the only actually dispositive piece of data is contained in the satellite image (either there is a charcoal site there or not) which our model doesn’t look at! Of course, we are proxying for the information contained in the satellite image since we are training our model on the upstream CNN’s model’s output score, that is, how likely there is a charcoal site based on the image. Taking a look at the SHAP values tells us some more:
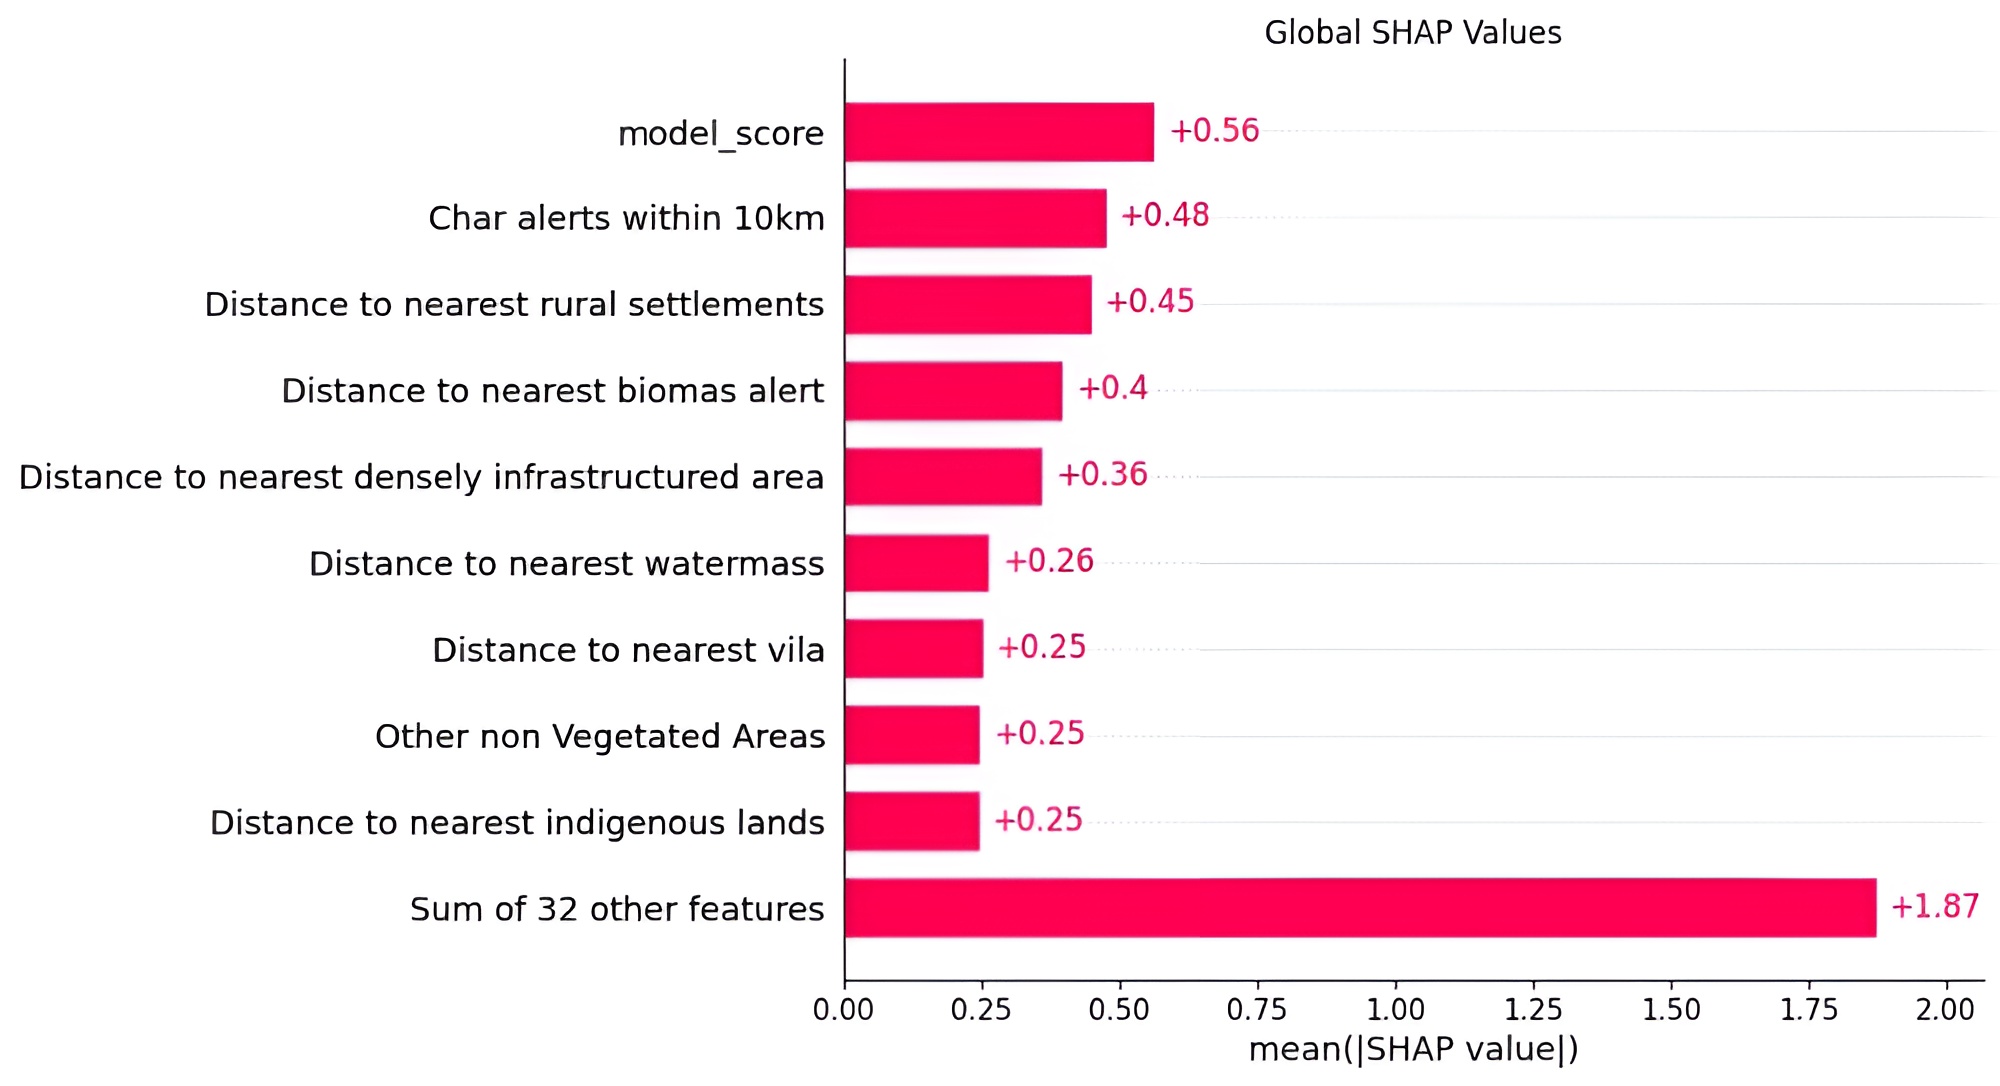 Calm luh SHAP values.
-
World Steel Association: Annual Production Data 2023 ↩︎